The first thing you see when you open Image SEO is the stats dashboard — a row of cards above the image table that reports how much of your media library has been optimized, and how each SEO field is doing. The numbers are calculated in the background and cached, so the page never waits on a recount.
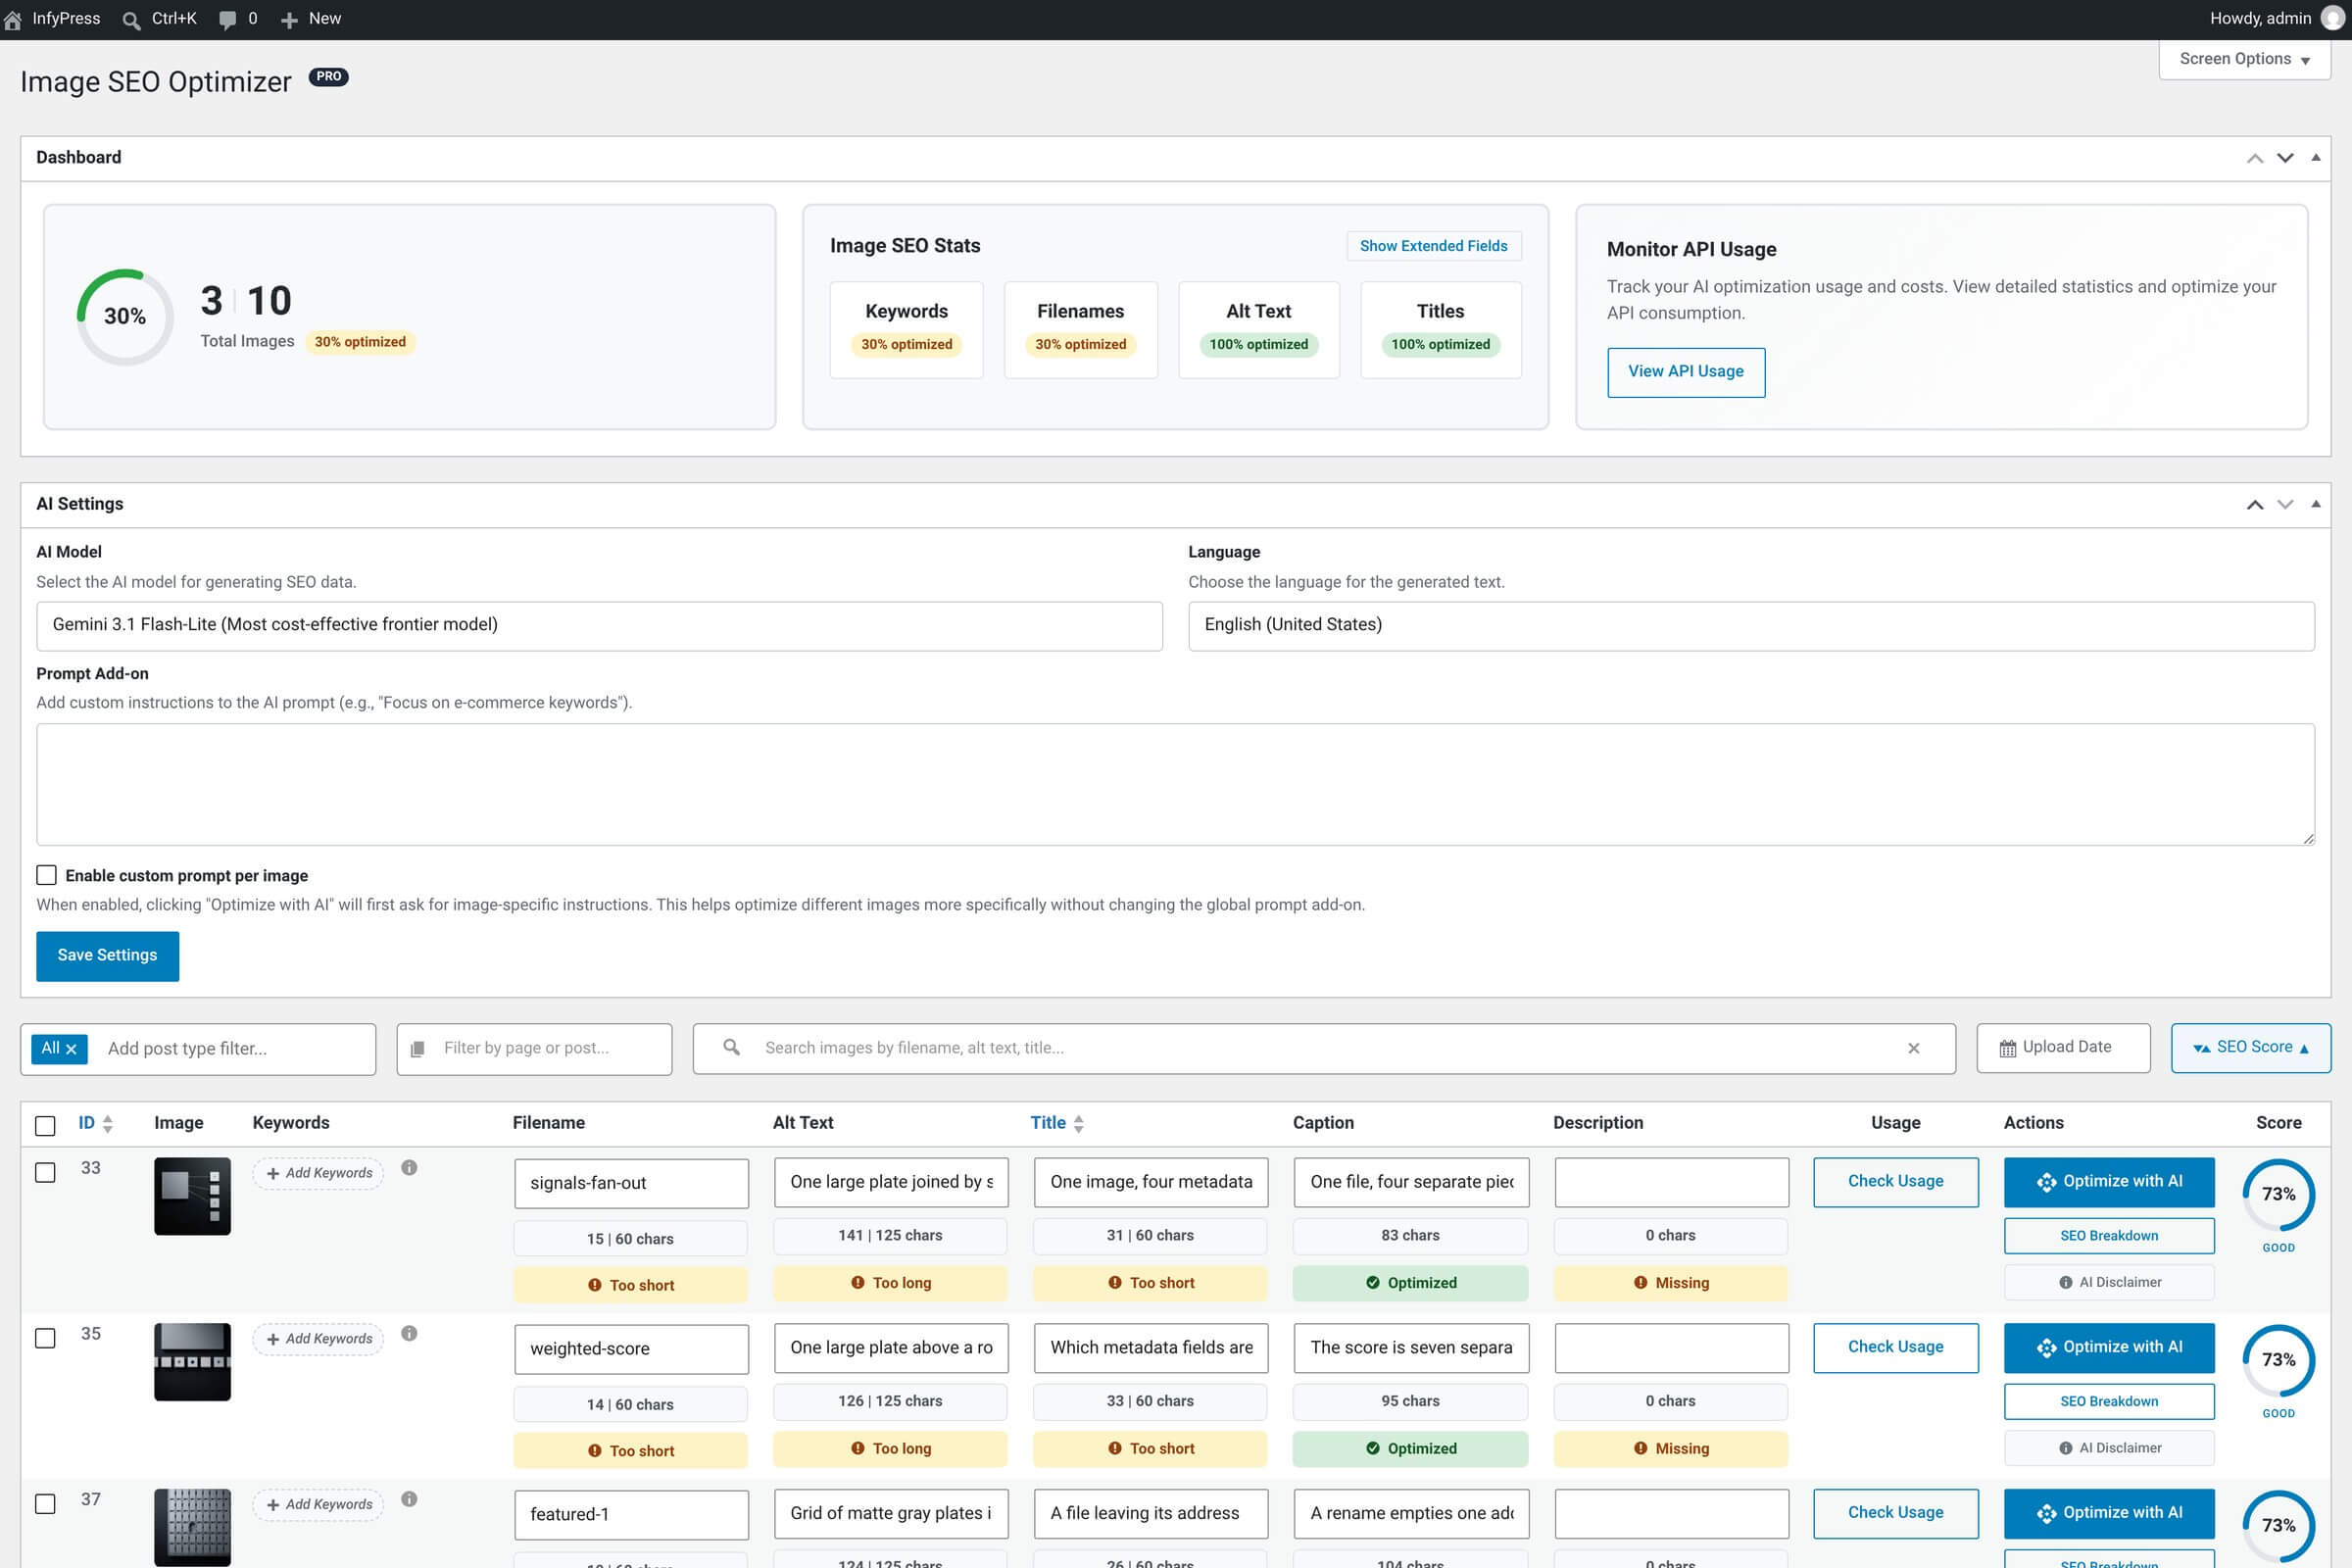
The cards
Five cards make up the free-plugin dashboard. The Total Images card on the left reports coverage for the whole library; the four cards beside it report one SEO field each, so you can see where the gaps are rather than only how many there are.
Free-plugin cards
| Feature | What it counts |
|---|---|
| Total Images The library-wide card on the left. | Optimized images over total images, drawn as a percentage ring with a badge reading {n}% optimized. Total counts image attachments and skips SVG; optimized counts the attachments carrying the meta key _infyp_has_been_optimized with the value 1. |
| Keywords Per-field card. | Share of images with a non-empty _infyp_keywords value. AI-generated and hand-edited keywords count the same. |
| Filenames Per-field card, and the strictest of the four. | Share of images whose filename passes the filename check: lowercase letters, digits and hyphens only, and both length ranges met within the configured tolerance. IMG_2034 is matched as a camera name and counts as unoptimized. |
| Alt Text Per-field card. | Share of images with a non-empty _wp_attachment_image_alt, the value WordPress itself stores. Alt text typed into the Media Library counts too. |
| Titles Per-field card. | Share of images whose title is neither empty, shorter than 3 characters, nor a stock camera or screenshot pattern — digits only, IMG_1234, DSC_1234, anything starting with Screenshot, image-1, photo-1. |
Every percentage carries a badge, and the threshold is the same on all five cards: 80 percent or above renders in the good state, anything below it renders as a warning. The badge is a reading aid, not a grade — it says nothing about how well the text scores.
Coverage and quality are two different numbers
The ring on the Total Images card is coverage — how much of the library has been through an optimization at all. It is not the average SEO score. Before 1.0.6 the card printed that average instead, so a fully processed library still read below 100 whenever the generated text sat outside the configured length ranges. The average is still calculated; it is just not shown on this card. Per-image scores live in the image table and the SEO breakdown.
Pro adds two more field cards Pro
With Image SEO Optimizer Pro active, a Show Extended Fields button appears in the card header and reveals two more cards, for the two fields only Pro generates. The button is rendered only when something is registered on the dashboard’s extended-stats hook, so the free plugin never shows an empty control.
Pro cards
| Feature | What it counts Recommended |
|---|---|
| Captions Pro-only field, stored in the attachment excerpt. | Share of images with a non-empty caption. |
| Descriptions Pro-only field, stored in the attachment content. | Share of images with a non-empty description. |
The Pro cards are sampled, not counted
Captions and Descriptions are measured on a sample of up to 200 of the most recently added images, scaled up to the library total, then cached for five minutes. The sample does not skip SVG files the way the four free cards do, so on a library full of icons both figures read low. Treat them as estimates.
How and when the numbers refresh
Recounting every image in a busy media library is expensive, so the plugin does not do it on every page load. The stats are calculated in the background and stored in the option infyp_cached_dashboard_stats. The cards read that cache, which is why the dashboard opens immediately.
The background task runs on the infyp_calculate_stats hook, scheduled on WordPress’s built-in hourly interval when the plugin is activated. WP-Cron is triggered by traffic — on a quiet site, the hourly run happens on the first request after it falls due rather than on the minute.
There is no Recalculate button, and you do not need one
The cached stats are deleted whenever an image attachment is added, edited or deleted, whenever alt text changes, and after every optimization the plugin runs. The next time the dashboard loads with no cache present, it recalculates on the spot and stores the result again. So a batch you just optimized is reflected as soon as you reload the page; the hourly run is the backstop for changes that bypass those hooks, such as direct database writes.
The Filenames percentage is an extrapolation
Reading a filename means touching the filesystem, so each run checks a random sample of up to 200 images and scales the result to the full library. On libraries over 200 images the Filenames figure shifts slightly from run to run even when nothing has changed. The same sample also feeds the average SEO score. The other three field percentages are counted across every image with a single query each.
Next steps
Image List Table
The image table below the stats — every column, filter and sort, explained.
AI Settings (Meta Box)
The settings panel that sits next to the image table — model, language, prompts.
SEO Scoring System
How each image's score is calculated, including the length ranges and their tolerance.